
Yulia Pavliuk is a financial content writer with a background in language, education, and clear communication. She creates SEO-friendly articles that make complex finance topics like ETFs and forex signals clear and accessible, with a strong focus on UK audiences.

Advertising Disclosure
We may receive compensation from our partners for placement of their products or services, which helps to maintain our site. We may also receive compensation if you click on certain links posted on our site. While compensation arrangements may affect the order, position or placement of product information, it doesn’t influence our assessment of those products.
Investors use different approaches to decide when to buy or sell a financial asset. Some focus on company accounts and economic news, while others study price movements in the market itself. This second method is known as technical analysis. It uses past prices and trading activity to look for trends, patterns, and signs of where the market might go next.
For someone new to investing in the UK, it can help make sense of short-term market changes and give ideas on when to buy or sell. Whether you want to find the right time to invest in an FTSE 100 company or take profits from a well-known high-street brand, the idea is simple: market movements often repeat because people tend to react in similar ways over time.
In This Guide
What Is Technical Analysis?
Technical analysis examines how prices change over time. Instead of studying a company’s profits or the wider economy, it focuses on market data such as price charts and trading volumes to predict where prices might go next.
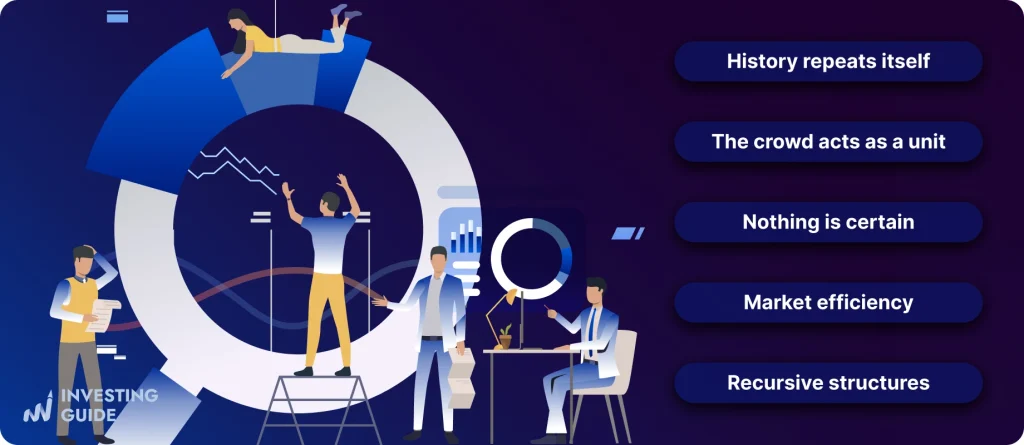
The idea is that all known information, from company results to political events, is already reflected in the price. By spotting patterns in past price movements, traders try to work out what might happen in the future.
For example, a trader might examine a chart of Barclays shares and notice a shape called a “double bottom”. If this shape has often been followed by a price rise, the trader may see it as a good time to buy. The aim is not to be certain, but to improve the chances of making a profitable trade.
Key Technical Factors
Several market elements influence how technical analysis is applied. These technical factors can shape how traders interpret charts and signals:
Price trends
Markets often move in a clear direction – up, down, or sideways. Spotting the main trend can help traders avoid going against the flow. Even a strong company like Tesco may see its share price fall if the whole sector is under pressure.
Support and resistance levels
These are price points where an asset often stops moving lower (support) or higher (resistance). They act like psychological barriers where many traders choose to buy or sell. If Lloyds’ shares have bounced off 40p several times, that level becomes important to watch.
Trading volume
Volume indicates the number of shares or contracts traded in a specified period. High volume during a price move can signal strong interest, while low volume may mean less conviction.
Volatility
This measures how much and how quickly prices change. High volatility can offer more opportunities to trade but also increases risk. A stable utility stock often moves less than a mining company affected by swings in commodity prices.
Timeframes
Charts can show data for minutes, days, or months. A day trader might watch minute-by-minute moves, while a long-term ISA investor may prefer weekly or monthly charts.
Technical Analysis Basics
Before using specific tools, it’s important to understand the core ideas behind technical analysis.
Trends and cycles
Markets rarely move in a straight line. Prices fluctuate in waves, forming trends that can last from minutes to years. Smaller cycles within these trends are shaped by news, sentiment, and economic shifts. Identifying the main trend helps align decisions with the market’s direction.
Patterns
Certain chart shapes repeat over time, such as continuation patterns (pauses before resuming a trend) and reversal patterns (trend changes). UK traders often watch for “head and shoulders,” which can signal a potential momentum shift.
Confirmation
Signals are stronger when backed by other evidence. A breakout above resistance with rising volume, for example, is more convincing than the same move on low volume.
Risk management
Even strong setups can fail. Stop-loss orders limit losses by automatically closing trades at a predetermined price. On the other hand, a clear risk plan protects capital and curbs emotional decisions. For instance, a trader might wait for MACD confirmation before acting on overbought RSI readings.
Common Chart Patterns
Identifying chart patterns plays a key role in technical analysis. These shapes form as traders buy and sell, showing changes in supply and demand. Some patterns suggest the current trend will continue, while others point to a possible reversal.
Head and shoulders
A reversal pattern with three peaks: smaller ones on each side (shoulders) and a taller one in the middle (head). It can indicate an uptrend losing strength. The inverse version suggests a potential shift from a downtrend to rising prices.
Double top and double bottom
A double top forms when the price peaks twice at a similar level before falling, signalling a possible decline. A double bottom shows two similar lows, often hinting at a potential recovery.
Triangles
Symmetrical, ascending, and descending triangles show consolidation before a breakout. Ascending triangles often break upward; descending ones tend to break lower.
Flags and pennants
Short-term continuation patterns following a sharp move, signalling a pause before the trend resumes.
Cup and handle
A bullish continuation pattern with a rounded “cup” followed by a small pullback or “handle.” A breakout above the handle may indicate further gains.
Patterns are not guarantees, but combined with indicators and volume analysis, they can offer valuable trading insight.
Technical Analysis Indicators
Technical indicators are tools that analyse price and trading volume data to generate signals. They help traders spot trends, measure momentum, and identify possible changes in market direction. Among the many options available, some are especially useful for beginners.
Moving averages
Relative Strength Index (RSI)
Moving Average Convergence Divergence (MACD)
Bollinger Bands
Volume-based indicators
Smooth out short-term price changes to reveal the overall trend. A 50-day simple moving average (SMA), for example, can indicate an uptrend if a share trades consistently above it.
RSI evaluates the speed and magnitude of recent price movements on a scale of 0 to 100. Readings above 70 can point to overbought conditions, while those below 30 may suggest oversold levels.
Compares two moving averages to highlight momentum shifts. A cross above the signal line can suggest rising momentum; below, potential weakness.
This indicator uses a moving average with two bands above and below it, calculated from standard deviation. When prices approach the upper band, it can signal overbought conditions; nearing the lower band may indicate oversold levels.
Tools like On-Balance Volume (OBV) combine price movement with trading volume to show whether buying or selling pressure dominates.
Indicators are often most effective when used together. For example, confirming RSI signals with MACD.
Fundamental vs Technical Analysis
Technical analysis is one way to study investments. Another is fundamental analysis, which examines a company’s financial position, industry role, and the broader economy.
Fundamental Analysis
This involves reviewing company accounts, profit margins, and competitive strengths. For example, an investor might choose Unilever because they believe it will keep growing for years, even if its share price fluctuates in the short term.
Technical Analysis
This method focuses on timing. It examines price charts and trading activity to identify the best moment to buy or sell. The aim is to identify patterns that signal when to act.
Many UK investors use both. They may select a company using fundamental analysis, then apply technical analysis to choose the right time to invest. This approach can help pair a strong business with favourable market conditions.
Limitations of Technical Analysis
Technical analysis can help improve timing, but it is not foolproof.
No guarantee of accuracy
Past price behaviour does not always predict the future. Unexpected events, such as an interest rate change from the Bank of England or company-specific news, can disrupt even strong technical signals.
Subjective interpretation
Two traders may view the same chart differently. One might see a breakout, while another sees a false signal.
Market noise
Short-term movements can be random. Without context, it is easy to mistake noise for a genuine signal.
Over-reliance
Relying only on technical indicators can lead to missed risks. Ignoring factors like earnings announcements in favour of a chart pattern may result in surprises.
Discipline required
Even an accurate analysis can fail without solid risk management. Many beginners find it harder to stick to their plan during losing trades than to spot the trade itself.
FAQs
Is technical analysis suitable for beginners?
Yes. It can help newcomers understand price movements and identify entry or exit points. Starting with simple tools like moving averages and support/resistance levels builds a solid foundation before tackling more complex methods.
Do I need special software for technical analysis?
Not always. Most UK trading platforms include charting tools with core indicators. Dedicated platforms such as TradingView offer more advanced features and greater customisation.
Can technical analysis predict the market with certainty?
No. It deals with probabilities, not guarantees. Even strong signals can be disrupted by unexpected events.
Should I combine technical analysis with other methods?
Yes. Many traders pair it with fundamental analysis—selecting quality assets based on fundamentals, then using technical signals to time their trades.
Conclusion
Technical analysis provides a structured framework for understanding market trends and price movements. Mastering chart reading, recognising patterns, and applying indicators can enhance decision-making. However, its effectiveness depends on disciplined risk management and integration into a wider investment strategy. It is not a tool for certainty, yet with consistent practice and continual learning, it can become a valuable and reliable part of any trader’s approach.
Related Articles:

The part about trying different timeframes when starting out is solid advice, though I'd add that most beginners get overwhelmed jumping between too many charts and end up second-guessing themselves constantly.